
Forecasting stock prices using random forest regression
Published:
Lately, I have wondered how people forecast the stock market? How do people in the finance industry make so much money by predicting the future?
Based on this article, random forest regression is used in predicting stock prices.
Random Forest Regression
Random forest is a ensemble learning method which uses multiple decision trees to form a prediction. This can be appleid to both classification and regression. This techniques works by creating multiple decision trees which is each trained on a subset of the data. These decision trees are created by using bootstrapping, where data points are randomly selected with replacement to form the datasets for each tree. Once all the trees make a prediction, the final prediction is made by averaging all the decision tree’s predictions through a process called aggregating. By averaging the predictions of several decision trees into one prediction, this can minimise the variance and lead to more accurate and stable predictions.
Here is a simple diagram of the random forest regression (Credit: https://www.geeksforgeeks.org/machine-learning/random-forest-regression-in-python/). 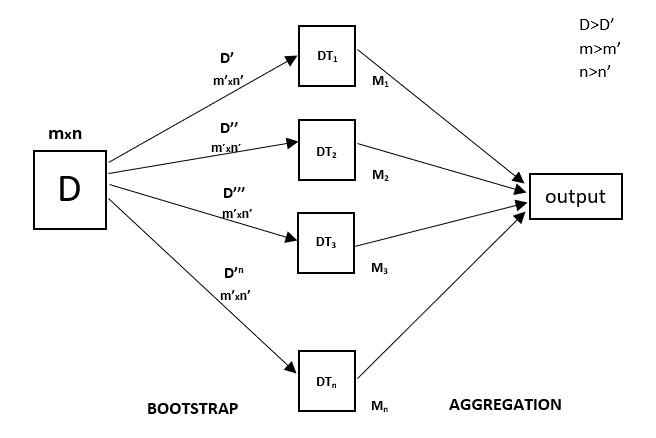
Analysing stock prices in python
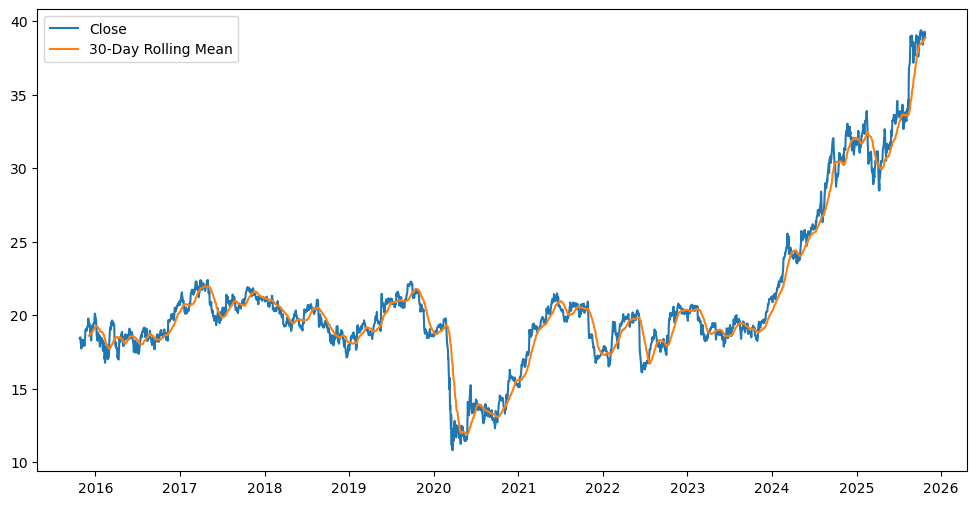
You can conveniently use the Yahoo Finance python libaray yfinance to download the data for a particular stock price, for example NVIDIA. As a warm-up, let’s plot the closing price of Nvidia everyday for the last 5 years.
import yfinance as yf
import matplotlib.pyplot as plt
ticker = "NVDA"
data = yf.download(ticker, start='2020-10-25', end='2025-10-25')

data['Return'] = data['Close'].pct_change()
data['Rolling_Mean'] = data['Close'].rolling(window=30).mean()

plt.figure(figsize=(12,6))
plt.plot(data['Close'], label='Close')
plt.plot(data['Rolling_Mean'], label='30-Day Rolling Mean')
plt.legend()
plt.show()
Now, we wish to train on the past stock prices. First we divide the dataset into training and testing data. Here, I chose to do a 80:20 split.
In progress